NatureOnYourScreen

|

|
Education
Extraordinary lessons
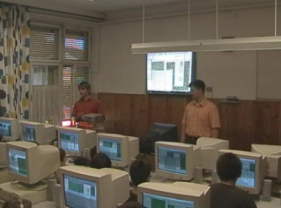 An average lesson begins with the biological systems display and with the descriptions of the fundamental concepts in the first ten minutes.
The significance of the food web and the food pyramid is presented by the simple savannah example of the Serengeti National Park where the
role of the predator lion is highlighted as well as some vegetarian gnus, zebras and Thomson gazelles; the vegetation of the savannah is also mentioned.
Next, the problem of the investigation is shown to the group: What happens if not 4-5 but around 50 species are interacting with each other?
This problem will be easier to understand with computer science equipment to model the relationship between the species feeding habits
and the changes depending on the population's timely size.
The students are gradually introduced to the needed ecological investigation methods. It must be mentioned that in the 1920's experts managed
the first successful tries to model the interdependence of the two predatory related populations, which are called the Lotka-Volterra differential equations.
Their well-known graph, in biological fields, counts up the hunted arctic rabbits near the Hudson Bay Area and its feeding lynx furs: a function of time over a century.
This graph illustrates the fluctuation of the number of species in nature. With the following playful question their creativity can be stimulated in an interactive way:
"What is important in a rabbit's life to be able to stay alive?" After the warmly-welcomed first shy replies such as "food" or a "hiding place,"
ideas come in a mass and sooner or later the most important factors are stated by the students. We seamlessly transition the topic to the structure of our model,
which happens in the next five minutes: the square grid presents an area similar to the game of chess where there animals are playing.
Here we emphasize that measuring parameters, like time units, distances and weight, are recorded by the model, e.g. the animals' starvation tolerance,
the number of the descendants, the radius of their mobility or the plants total weight in one area unit.
An average lesson begins with the biological systems display and with the descriptions of the fundamental concepts in the first ten minutes.
The significance of the food web and the food pyramid is presented by the simple savannah example of the Serengeti National Park where the
role of the predator lion is highlighted as well as some vegetarian gnus, zebras and Thomson gazelles; the vegetation of the savannah is also mentioned.
Next, the problem of the investigation is shown to the group: What happens if not 4-5 but around 50 species are interacting with each other?
This problem will be easier to understand with computer science equipment to model the relationship between the species feeding habits
and the changes depending on the population's timely size.
The students are gradually introduced to the needed ecological investigation methods. It must be mentioned that in the 1920's experts managed
the first successful tries to model the interdependence of the two predatory related populations, which are called the Lotka-Volterra differential equations.
Their well-known graph, in biological fields, counts up the hunted arctic rabbits near the Hudson Bay Area and its feeding lynx furs: a function of time over a century.
This graph illustrates the fluctuation of the number of species in nature. With the following playful question their creativity can be stimulated in an interactive way:
"What is important in a rabbit's life to be able to stay alive?" After the warmly-welcomed first shy replies such as "food" or a "hiding place,"
ideas come in a mass and sooner or later the most important factors are stated by the students. We seamlessly transition the topic to the structure of our model,
which happens in the next five minutes: the square grid presents an area similar to the game of chess where there animals are playing.
Here we emphasize that measuring parameters, like time units, distances and weight, are recorded by the model, e.g. the animals' starvation tolerance,
the number of the descendants, the radius of their mobility or the plants total weight in one area unit.
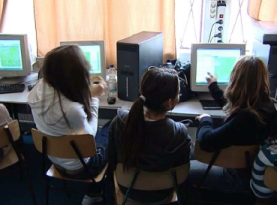
At this time, 20 minutes into the lesson, we reach the point where biology meets computer science: the model is given to the students, so everybody can learn to use the interface by playing a treated map, the zoom and the species number-time graphic on their own computer. This time the student are individually creating a "grass-rabbit-fox" ecosystem and are intentionally allowed to make basic errors such as not setting up the rabbit's parameters, which allow them to eat the grass. Consequently, after starting the running of the ecosystem, the rabbits start to die out. Then we ask the question: "What could be the cause of this?" After some thought, most students can recognize in chorus that there was nothing to eat for the rabbit. It is an especially important part of the lesson. From this part we can observe how useful it is to perform our work in pairs: one of us shows on the projector where to click and the other one goes to help those students who are left behind. This helps to avoid the unnecessary frustration of the fast-learning students getting bored while waiting for their classmates. Here can we measure how well the students understand the previous sets of information and how creative they are. We noticed that there are some of those who constructively start up the program: they experiment with the parameters or create new species and they apparently enjoy the game. By that time we are 30-35 minutes into the lesson. From that moment we present interesting and sometimes humorous cases so that the students can see new examples while running the events on their own computer at the same time. This is useful because the students are participating in the attempt and see if their classmates have different graphs but get similar results. In response to a question like, "What can be expected from this imbalanced ecosystem?" students give answers with their own words, sometimes as proper answers as can be seen in textbooks.
On average, in a 45-minute lesson we use remaining time to deal with three well-known phenomena. We begin with an interesting and entertaining example from the example of the "Australian big fence," which describes the spreading of a foreign invasive species. Later on the students face the quest of magnitudes: they can experiment with the area effect. The next environmental study is usually on deforestation, where students compare the biological values of the illegal and the professional logging patterns. If we get double lesson for a group, they may be able to study deeper and more exciting cases: we can pay attention to the different types of the pesticide sprays, which gives excellent opportunity to work individually or in groups in order to complete tasks. This is how students solve the problems without noticing the difference between the game and the task.
Role of the local area network
 More frequent problems arise during the continued usage of the model, primarily for the teacher. It can be difficult to follow the students'
work if the teacher does not see all of the monitors from the teacher's desk. With the help of the local network this problem can be solved,
as we can ensure the close communication between the teacher's server and the students' clients through which the teacher is able to monitor
the individual student's progress. This method also enables the teacher to help the individual students accordingly.
More frequent problems arise during the continued usage of the model, primarily for the teacher. It can be difficult to follow the students'
work if the teacher does not see all of the monitors from the teacher's desk. With the help of the local network this problem can be solved,
as we can ensure the close communication between the teacher's server and the students' clients through which the teacher is able to monitor
the individual student's progress. This method also enables the teacher to help the individual students accordingly.